[Editor CEC writes]: Occasionally we find something outside our baileywick that just seems to be special in the area of business and the economy…it has to be a story so logical and basic we can not resist passing it on, and this is one.
You may say, who cares about banking, especially since banks no longer pay us more than dimes of interests on our life savings they hold. Its fun to hate our bank, but maybe this story will help some of us duck out from under one of those financial hailstorms that seem to come at us every five or ten years. The last one took off quite a lot of skin and some arms, legs, and some heads, starting about 2006… remember the great bank bail out and the housing bubble? I thank this author, draw your own conclusions.
The article “The Banking System Must Lead Economy And Stocks Higher, Here’s Why It’s Not Happening” by Richard Stuttmeier, can be summed up in these two quotes in the article: “The banking system has not been able to return to leadership for several reasons including, tough regulations, continuing legal problems and residual problems from the Great Credit Crunch…Before the housing bubble popped mortgage lending was a huge part of the business model for our nation’s biggest banks. Not anymore!
He continues: “To sum it all up, the banking system cannot and will not provide the leadership needed to underwrite economic growth. The evidence of this notion is clearly shown in the FDIC Quarterly Banking Profile, which is the balance sheet of the U.S. economy. The bottom line is that you cannot have a bull market for stocks with a bear market in bank stocks.”
The Banking System Must Lead Economy And Stocks Higher, Here’s Why It’s Not Happening Richard Suttmeier, 2/9/2016
The Great Credit Crunch began with the issuance of risky subprime mortgages by the nation’s biggest banks and overexposures to commercial real estate loans around the country by community banks. These obvious issues were ignored by the banking regulators who repeatedly stated that the subprime issues were sustained and would not spread to the “real economy.” They ignored the facts that stocks in the housing market peaked a year earlier in the middle of 2015, and that the parabolic rise in home prices was a bubble ready to pop. It appeared to me that the banking regulators never look at charts and thus would never admit that problems were about to cause what I call, the Great Credit Crunch, that continues in 2016.
I began to focus on the housing and banking industries in 2005, and tracked the problems as they evolved.
For example, I knew that staff analysts at the Federal Deposit Insurance Corporation were warning chief regulators that community banks were lending to community developers and home builders at levels that were above prudent levels versus risk-based capital.
Overexposures to construction and development loans by community banks became evident as the housing bubble was inflating. The banking regulators, the U.S. Treasury, the Federal Reserve and the FDIC established guidelines for risk exposures to commercial real estate loans too late in the cycle.
The regulatory guidelines set at the end of 2006 indicated that exposures to CRE loans should not exceed 300% of risk-based capital and that the more-risky construction and development loans should not exceed 100% of risk-based capital. The banking regulators ignored their own guidelines to the peril of the banking system. Banks were making record profits so the regulators did not take action then and just let the banks fall like dominoes beginning in 2008.
The community bank index peaked in December 2006 and the regional banking index peaked in February 2007. Without bull markets in housing and banking, the bull market for stocks could not be sustained and thus the crash of 2008 followed. As these events evolved, the American dream to own a home became a nightmare.
So who caused the Great Credit Crunch? Blame it on Congress, the banking regulators and community and regional banks. Greed took over and homeowners, savers, consumers and small business on Main Street, USA are still paying the price today.
Here’s just one example. Even with home prices at levels that indicate a re-inflating bubble, residual issues remain in place. Today, in Tampa Bay where I live, 20% of all mortgages are still underwater. In addition, 25% of renters in Tampa Bay pay more than half of their income for housing.
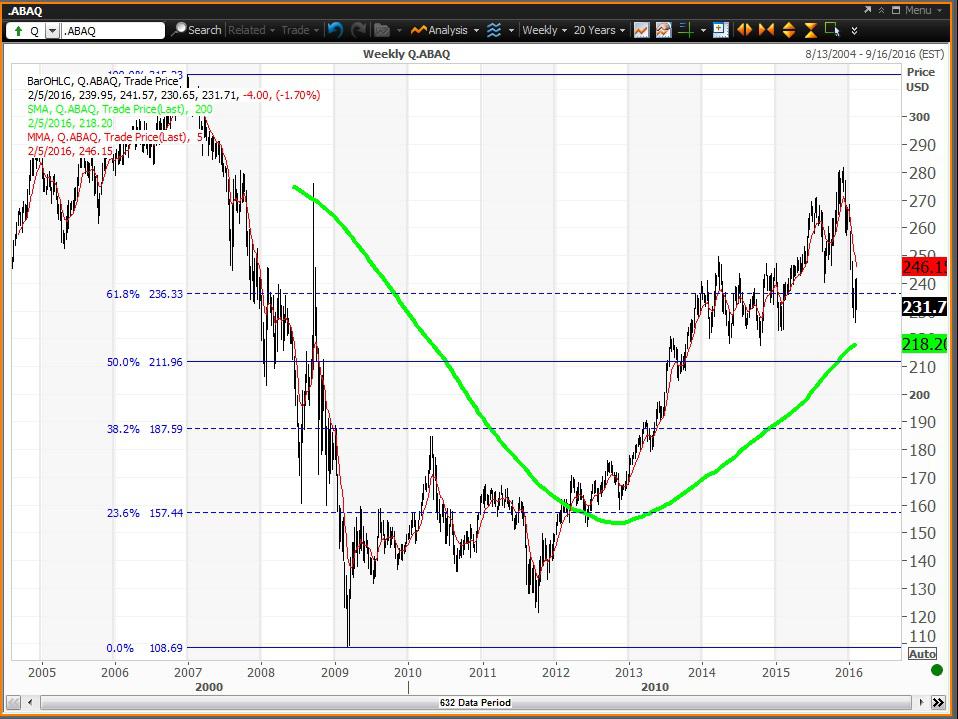
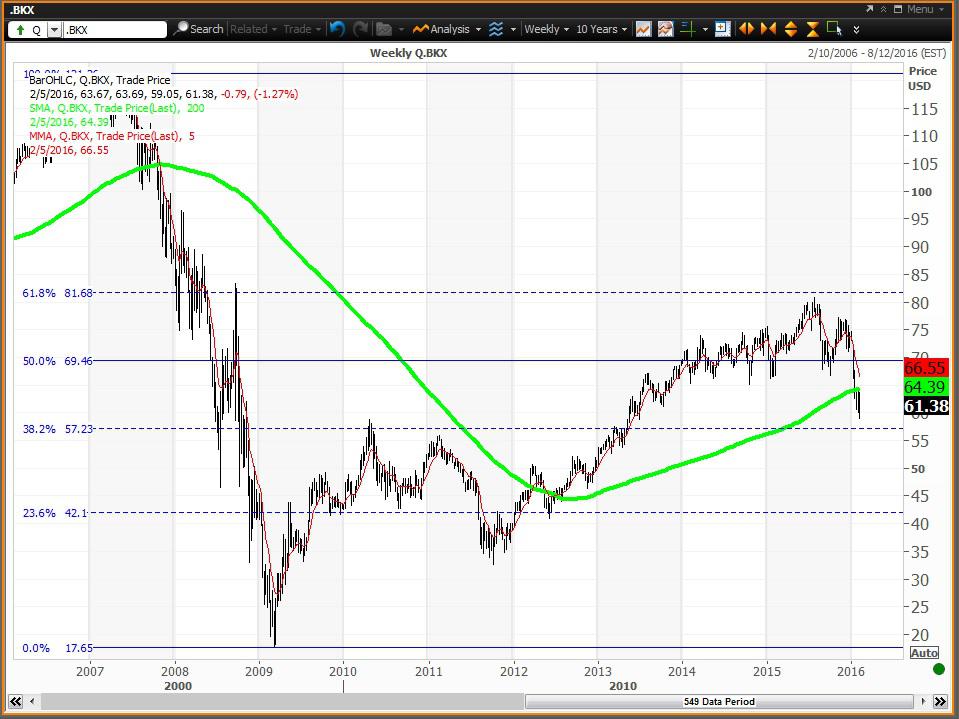
Here are weekly charts for two key banking indices.
The ABA Community Bank NASDAQ Index (ABAQ) had 500 publicly traded community banks as components before the Great Credit Crunch began, with a long waiting list. Today, there are only 354 bank stocks that qualify as members. This index peaked at 315.05 in December 2006 then bottomed at 108.55 in March 2009 down 65.5% from the peak. Note that the index has been trading back and forth around its 61.8% Fibonacci Retracement of 236.33 since December 2013. This index is in correction territory 17.7% below its multiyear high of 281.64 set on Dec. 1.
Charts Courtesy of MetaStock Xenith
The KBW Bank Index (BKX) includes the 24 largest banks including the four money center banks considered “too big to fail.” This index peaked in February 2007 at 121.16 and declined 85.3% to a low of 17.75 in March 2009. Note that this index is trading between its 38.2% Fibonacci Retracement of 57.23 and its 50% retracement of 69.46 and has not been above its 61.8% retracement of 81.68 since this bubble popped. This index is in bear market territory 24.1% below its multi-year high of 80.87 set on July 23.
Here’s a table that shows the residual problems in the banking system as evident by levels at the end of 2007 and the levels at the end of the third quarter of 2015.

Number of Banks – Each quarter since the end of 2007, the number of FDIC-Insured financial institutions continues to shrink. At the end of the third quarter of 2015, the number of banks are down 26.5% to 2,263. This includes 513 closed using the bank failure protocol.
Number Of Problem Banks – The FDIC keeps a non-published list of problem banks. While the numbers are down significantly to 127, they are still 167% higher than at the end of 2007.
Number of Employees – By now if the banking system was back in good health it would be creating jobs. Not so, as jobs have been slashed in every quarter since the end of 2007 and the labor force is down 8% since the end of 2007. Many banks are still planning additional layoffs.
Residential Mortgages (1 to 4 family structures) – Mortgage loans on the books of our nation’s banks are down 16% since the end of 2007. Banks do not want the risk of underwriting home ownership, which should be a growth business by now.
Construction & Development Loans – C&D loans have been rising in recent quarters from a base of about $200 billion, but are down 58% since the end of 2007. Most of the $200 billion are residual bad loans. The number of community banks overexposed to C&D loans are on the rise again, which is a warning that the housing bubble is re-inflating.
Home Equity Loans – Second lien loans to homeowners who borrow against the equity of their homes continues to decline each quarter and at the end of Q3 2015 is 22.4% below the level at the end of 2007. Lack of growth in HELOC loans is surprising given the rise of 36% in home prices since March 2012. Regional banks have been half-heartedly soliciting to offer these loans, but then find an excuse to turn down applications. This hurts homeowners as their credit scores slip.
Deposit Insurance Fund – Each FDIC-insured institution faces periodic assessment to provide funds to protect insured deposits. The bigger the bank, the larger the assessment. The DIF is up 34% since the end of 2007, but Insured Deposits are up 50% putting a financial burden on the bigger banks. The growth of insured deposits is the result of the rise in deposit insurance guarantees to $250,000 from $100,000, which occurred during the height of the credit crisis.
DIF monies are funded by all FDIC-insured institutions via annual assessments. By law, the regulatory guidelines will have the fund at 1.35% of insured deposits by Sept. 20, 2020. At the current level of insured deposits, the DIF would have at least $86.7 billion, so there is still work to do.
Reserves for Losses – The money set aside to cover failed assets has been declining as the healing process of the banking system continues. However, reserves are 17% above the level at the end of 2007.
Noncurrent Loans – Bad loans have declined significantly, but residuals remain high as noncurrent loans are still 27% above the level at the end of 2007.
The bottom line is that the banking system is not in a position to help generate economic growth, and the longer it takes, the more likely scenario is that additional problems will surface.
When the FDIC released the Quarterly Banking Profile for the third quarter of 2015, FDIC Chairman Martin J. Gruenberg discussed concerns about credit risks banks were making by extending further out on the yield curve to mitigate the impact that low rates have on net interest margins.
Also mentioned were concerns about loan portfolios in regions of the country that depend upon oil and gas revenues. Loan exposures are up while the price of energy are down, which is a tough environment for lenders. Since then, the bond market has experienced the crash of junk bonds, and the banking system will share in this burden.
Wall Street has been telling investors that regional banks benefit from higher interest rates, but the FDIC does not share this opinion. The banking system has become more vulnerable to rising interest rates and to the widening of spreads versus the U. S. Treasury yield curve.
The FDIC is also worried about increasing exposures to riskier loan categories including loans to leveraged commercial borrowers and relaxed underwriting standards for auto and multifamily housing construction.
To sum it all up, the banking system cannot and will not provide the leadership needed to underwrite economic growth. The evidence of this notion is clearly shown in the FDIC Quarterly Banking Profile, which is the balance sheet of the U.S. economy. The bottom line is that you cannot have a bull market for stocks with a bear market in bank stocks.
Disclosure:I/we have no positions in any stocks mentioned, and no plans to initiate any positions within the next 72 hours.
I wrote this article myself, and it expresses my own opinions. I am not receiving compensation for it (other than from Seeking Alpha). I have no business relationship with any company whose stock is mentioned in this article.

How about taking the conttol of the money from Jews. Then, banking problem solved. It’s that simple.